Quality Control (QC) Charts are used to monitor changes in laboratory accuracy and precision over time. The statistical procedure was originally developed by Walter A. Shewhart and in his honor, they are also known as “Shewhart charts”. Two charts are usually used: X-Chart controls the method’s accuracy, and R-Chart monitors method’s precision.
In this example, we will monitor recoveries of Laboratory Control Samples (LCS1) and a duplicate spike LCS2. Below you can see an example of an X-chart. The red lines above and below the experimental points are called Upper Critical Limit (UCL), and Lower Critical Limit (LCL). The central, green line represents the average historical recovery. Blue lines are called the Upper Warning Limit (UWL) and the Lower Warning Limit (LWL). The experimental points are shown as black and purple dots.
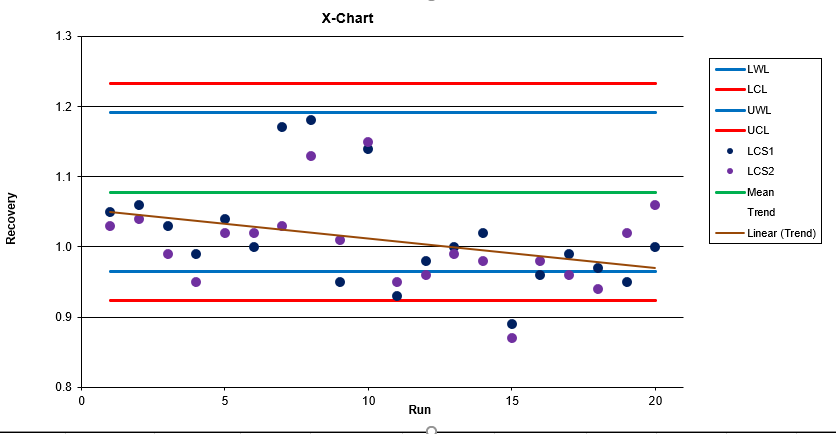
The main idea is that the current lab performance is compared with historical QC data, which gives the best measure that your statistical model is stable. For example, in March, you use your lab’s February performance to calculate the Warning and Critical limits, and if your current data are still within the historical limits, you know that your QC system is still valid. When you find your results being outside the critical limits, this is a clear indication that the QC system failed. You can see such example on the X-Chart above, where recoveries during run 15 were below the LCL.
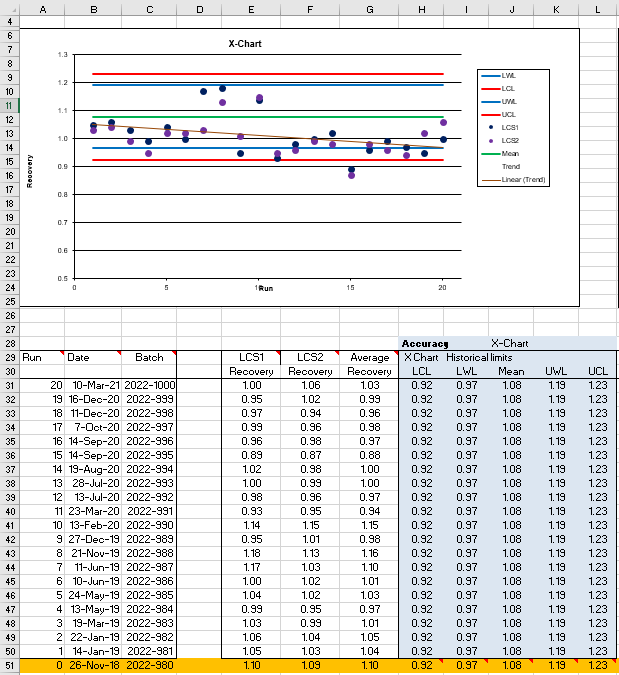
Now, let us build our own X-Chart to monitor the method’s accuracy. Create a table in Excel and type in the pairs of historical recoveries. You are welcome to use our template below. Be careful with the template since it is built for the methods where the relative error is small, and the errors can be described by a normal distribution of data.

Start with calculating the Central Line Xaverage as the average value of the cells E51:F70. In this example, the average recovery was 1.08 (cell J51)
Calculate the Standard Deviation (S) of the cells E51:F70. In this example S=0.11.
Calculate warning and critical limits as:
Lower control limit (LCL) = Xaverage -3S (Cell H51)
Lower warning limit (LWL) = Xaverage -2S (Cell I51)
Upper warning limit (UWL) = Xaverage +2S (Cell K51)
Upper control limit (UCL) = Xaverage +3S (Cell L51)
Now is time to add the most current data into cells E31:F50. Remember that the current experimental results are compared against the historical control limits. When the chart is organized this way, the outliers are easy to detect (see cells E36:F36), and trend analysis can be automated by adding a trend line (see a brown trendline on the chart)
Now, let us build an R-Chart using the same set of LCS1 and LCS2 data. We will monitor the precision of our measurements using Range, which is defined as:
R=ABS(RecoveryLCS1-RecoveryLCS2)
In other words, the range is the absolute difference between the 2 recoveries, and it is always a positive number. For each pair of historical recoveries, we calculate the range in cells P51:P70.
The mean recovery is calculated in cell Q51 as AVERAGE(P51:P70), and is used to create the centerline (green one) for R-Chart
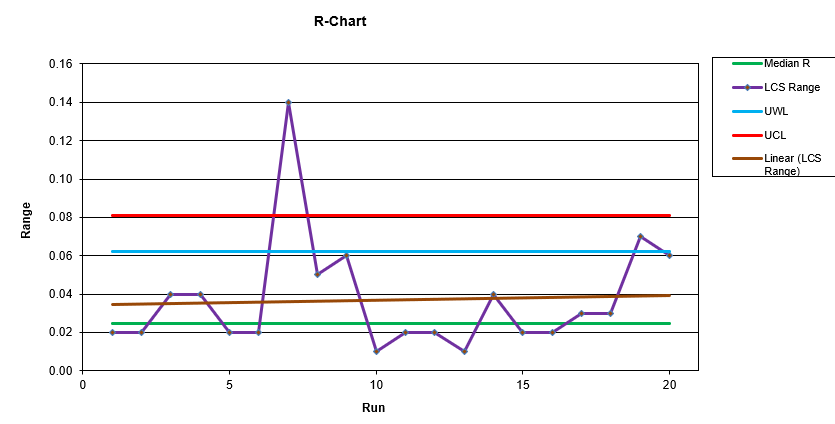
In chemical analysis, R-Chart has only UWL and UCL, because we are only concerned about a higher than the usual range of recoveries. The UWL (cell R51) and UCL (Cell S51) for R-Charts are calculated as follows:
UWL=Rmean*2.511
UCL=Rmean*3.266
Now we can calculate individual ranges (cell P31:P50) for the most recent set of experimental data points and compare them against the historical limits as seen on the R-Cart above. There we can see one non-conforming recovery during run #8.
If you need assistance with building a Quality Control System for your laboratory, please contact me to discuss how we can help. With 25 years of experience as a quality manager, I can create a robust system for your lab.
2 comments
Please let me have your X and R-card template downloadable.
It is downloadable