
Analytical chemistry encompasses a wide array of techniques and methods for quantifying and characterizing chemical substances. The precision of analytical measurements is a crucial aspect of quality assurance, as it directly affects the reliability of data. Precision is often expressed as Standard Deviation (SD) and/or Relative Standard Deviation (RSD). While the Standard Deviation is expressed in the same units as the measured parameter (let’s say concentration), the Relative Standard Deviation is unitless and expressed as a fraction. Sometimes, laboratories use SD and RSD almost interchangeably, stating, “We can measure cobalt concentration with SD=25ppm, which corresponds to RSD=0.07 (7%).”
This way of presenting precision is correct when your target concentration does not change much from sample to sample. When you analyze the samples with very different concentrations it is important to remember that SD and RSD can change significantly for different concentration levels.
While it is widely recognized that RSD can vary with concentration, the precise nature of this relationship and its implications for analytical chemists remain topics of interest and concern. Let’s explore possible correlations between Analyte Concentration (X) and RSD and how they relate to different statistical models. We will discuss the Normal distribution, Poisson distribution, and Lognormal distribution of errors in the context of analytical chemistry.
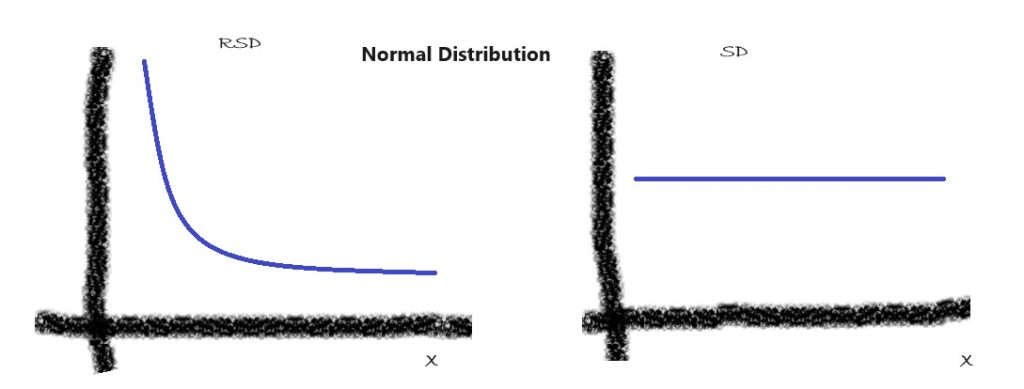
1. Normal Distribution:
The normal distribution, also known as the Gaussian distribution, is a fundamental statistical model often assumed to describe the distribution of errors in analytical measurements. It is based on the assumption that the standard deviation (SD) is a constant and does not change as the target concentration of an analyte (X) changes. The most common technique where SD is constant for a wide range of concentrations is gravimetric analysis. For this statistical mode, the RSD, calculated as
RSD = (SD/X) = Constant/X = Constant*X ‾¹
is inversely proportional to X.
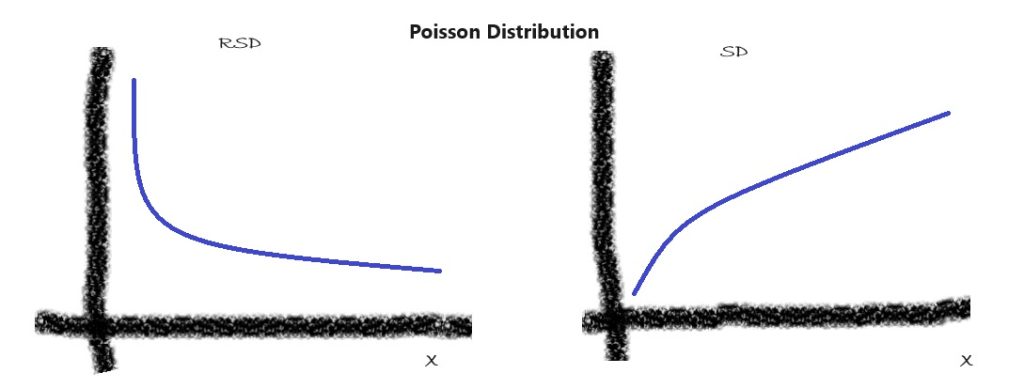
2. Poisson Distribution:
The Poisson distribution is frequently used as a statistical model for the interpretation of different counting methods, such as fibre counting or particle counting. In the traditional Poisson distribution model, RSD is proportional to the reverse square root of X, or
RSD = Constant * X ^(-0.5); SD=Constant * X ^(0.5)
This relationship signifies that as the concentration decreases, the RSD tends to increase.
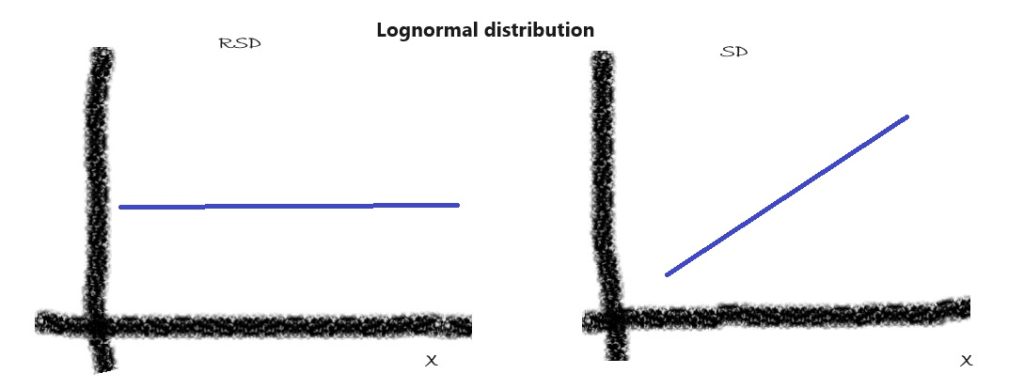
3. Lognormal Distribution:
In cases where the concentration data span several orders of magnitude, the lognormal distribution is often more appropriate than the normal distribution. This distribution is characterized by a constant RSD for a wide range of concentration levels. Typical examples of instrumental methods that fit the definition of lognormal distribution are Chromatography, UV-VIS, FTIR, and many other techniques. When you estimate the standard deviation of your results around the true value at different levels, you find that the standard deviation (SD) is proportional to concentration, while RSD does not change much within a wide range of concentrations:
RSD = Constant = Constant*X^0; SD= Constant * X
where the exponent ‘0’ signifies the concentration-independent nature of RSD in lognormally distributed data.
What Statistical Model Should I Use?
Selecting the right statistical model will provide better predictability of errors at different concentrations. Measure the RSD of your test at various concentrations, typically extracted from replicate analyses. Plot the RSD values versus the concentration of the analyte (X) and add a power trendline to your chart. Read the power value from the trendline formula. When the power value is -1, your data can be described by the Normal Distribution model. A power value of -0.5 suggests a Poisson distribution, while Lognormal distributions are expected to be fitted with a horizontal line (power equal to zero).
In many cases, you will find that your data are more complex, and the RSD-X correlation cannot be explained by any of the standard models. In such cases, you may need to develop your own model. Our next blog will explain how to do that.
After 40 years of Laboratory Managment and Quality Control, I can offer all my expertise to your laboratory. If your laboratory needs a third-party Quality Assurance I can offer online and in-person consulting. If you think that you can use my expertise, please contact me at your convenience.