
In chemical analysis, precision plays a pivotal role in determining the dependability and consistency of acquired test outcomes. One way to represent precision is the Relative Standard Deviation (RSD). The unitless parameter RSD offers valuable insights into the spread of data points around the mean, thereby assisting researchers and analysts in grasping the constancy and reliability of their measurements, even when the intended concentration remains variable.
The acceptable range for RSD varies considerably across distinct chemical methodologies and applications. For instance, within quantitative analytical techniques like titrations and gravimetric analyses, RSD values lower than 2-3% are frequently pursued, denoting a close grouping of measurements around the mean value. The instrumental techniques such as chromatography and spectroscopy, generally permit RSD values within the 3-8% range.
As a rule of thumb, the complex sample preparation and human factor tend to increase RSD. As a result, microbiological assays or microscopic examinations commonly produce results with an RSD of 10-30%.
In this blog, we want to explore the meaning of excessively high RSD values and the insights they offer regarding the precision of a laboratory test. Let us consider a scenario where we need to count the number of particles on a microphotography of a sample.

Though approximately 1000 particles are present on the slide, the actual count is unknown. For the purpose of our experiment, we will computer-generate random pairs of “experimental data” within a preset precision range and calculate the RSD for each pair of results and the average RSD for multiple repetitive measurements. The simple Excel file that we used for this experiment can be downloaded here.
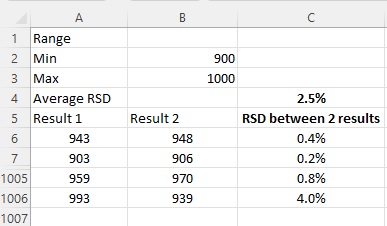
When results fall very close to each other between 900 to 1000 particles (11% range around the midpoint of 950 particles), mean RSD calculated as the average of 1000 repetitive pairs, is calculated at 2.5%.
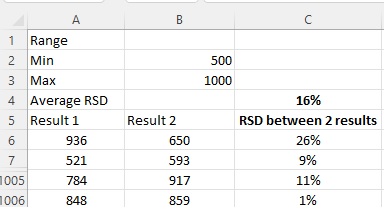
For data falling between 500 particles and 1000 particles (range is 67%), the mean RSD is estimated at 16%.
When results are precise within one order of magnitude between 100 and 1000 particles (range is 164% around median count), the mean RSD is equal to 41%
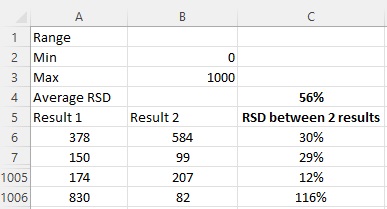
And finally, when the results are completely random by nature between 0 and 1000 particles (calculated rage is 200% of error is +- 100%). The mean RSD is obtained from this extensive set of randomly generated positive numbers stands at 56%.
Can the RSD exceed 55%? Indeed, it can. When one analyst consistently reports near-zero counts while the other consistently reports high counts, the RSD can surge to as high as 140%. Any RSD above 56% is an indicator of a systematic error.
After 40 years of Laboratory Managment and Quality Control, I can offer all my expertise to your laboratory. If your laboratory needs a third-party Quality Assurance I can offer online and in-person consulting. If you think that you can use my expertise, please contact me at your convenience.